Transformieren Sie Fertigungsprozesse mit PLM
Schaffen Sie bessere Fertigungsabläufe mit einer PLM-Software, die die Lücken zwischen Konzeption, Markteinführung und Wartung nahtlos überbrückt. Mit MES und KI nutzen die PLM-Lösungen von CLEVR die neueste Technologie, um genau die richtigen Arbeitsabläufe zu erstellen.
Eine einzige Quelle der Wahrheit
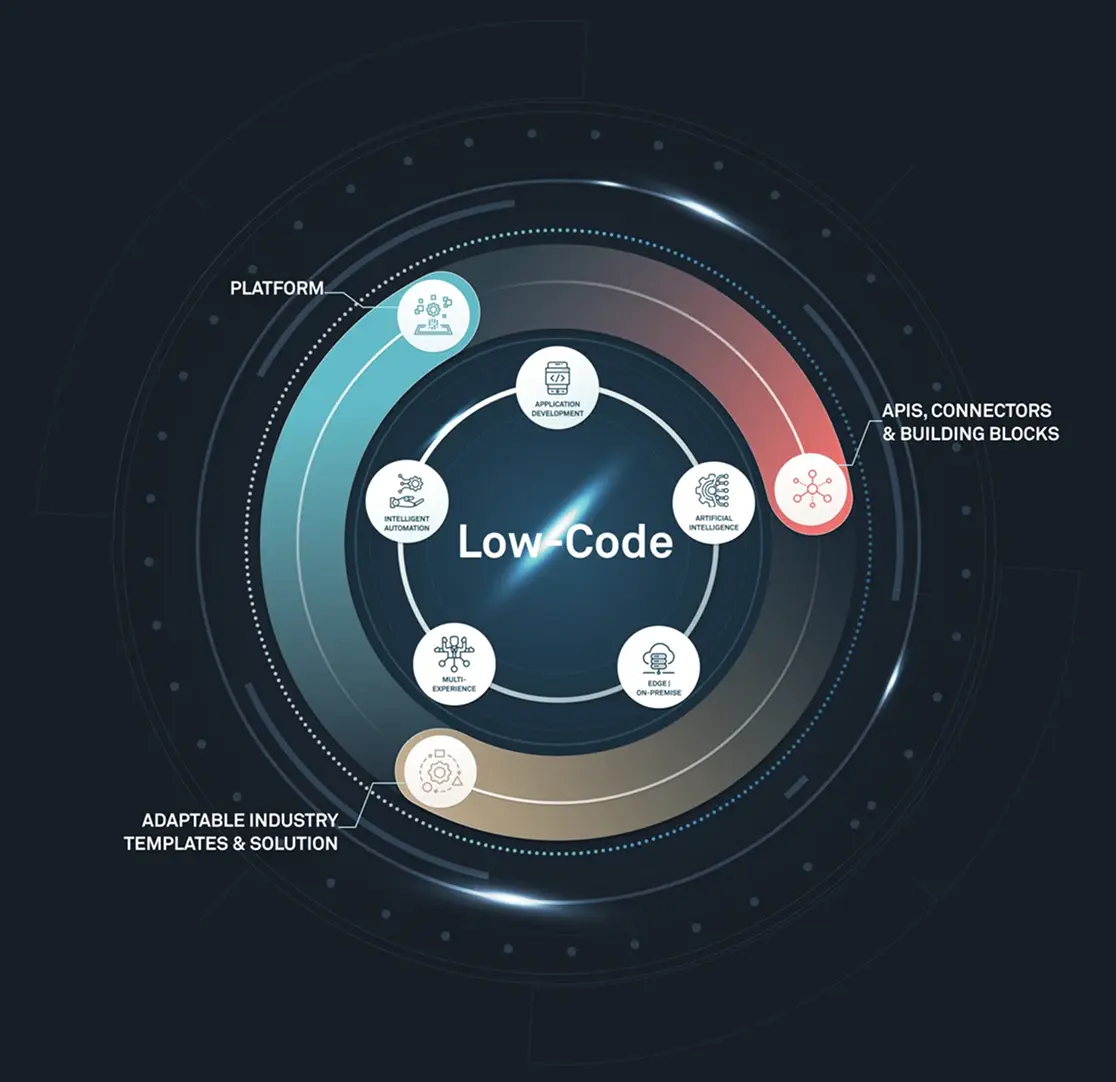
Low Code verbessert das Product Lifecycle Management, indem benutzerdefinierte Anwendungen angeboten werden, die sich nahtlos mit anderen Systemen verbinden lassen, oft mit Automatisierung. Die Automatisierung bestimmter PLM-Phasen optimiert die Bereitstellung, unterstützt die Entwicklung mobiler und nativer PLM-Apps und hilft Herstellern, komplexe Anwendungsfälle zu bewältigen, indem Informationen aus mehreren Quellen genutzt werden.
Effizienz entlang des Lebenszyklus: Von der Einführung bis zur Ausmusterung
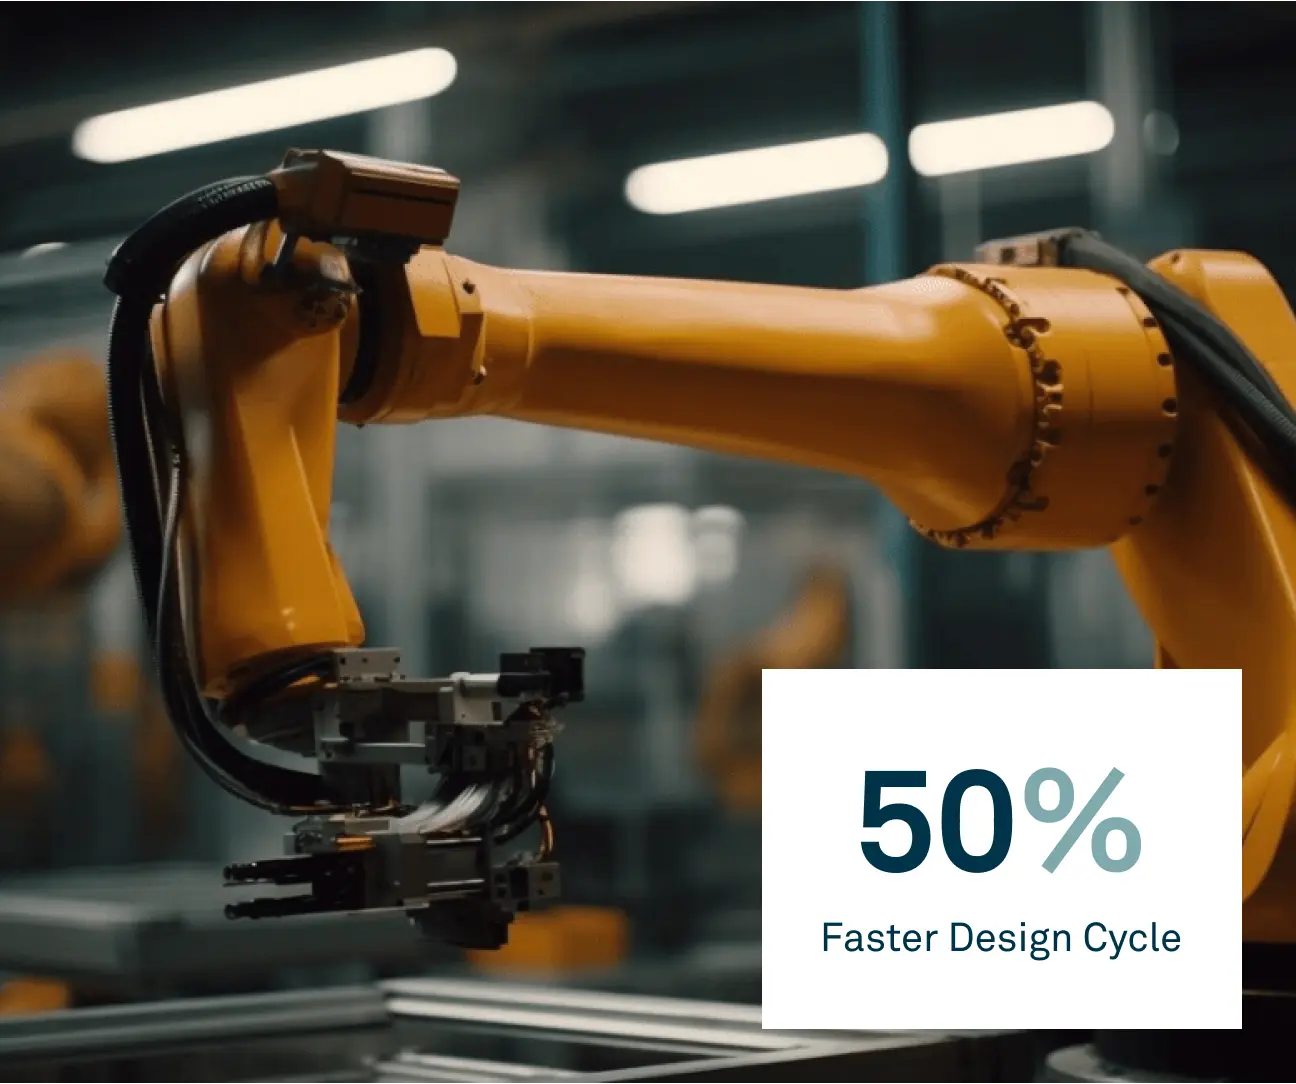
Konzept und Design
Erleben Sie schnellere Produktdesignzyklen mit einem fortschrittlichen CAD-System, das virtuelles Prototyping in 2D- und 3D-Umgebungen bietet. Dieses System integriert Robotik, 3D-Druck und Qualitätsprüfung. Die integrierten Konstruktions- und Fertigungsfunktionen von NX bieten eine effektive Plattform für eine effiziente Produktentwicklung.

Technik und Entwicklung
Um Fehler in der Produktentwicklung zu vermeiden, gilt es, die Entwicklung eng mit anderen Abteilungen abzustimmen und Technologien wie digitale Zwillinge und Simulation einzusetzen. Teamcenter beschleunigt den Weg vom Design bis zur Erprobung, fördert die Zusammenarbeit, steigert die Produktqualität und ermöglicht eine schnellere Markteinführung.
Menschen und Prozesse
Mit PLM befähigen Sie Ihre Teams, besser zusammenzuarbeiten, fundierte Entscheidungen zu treffen und einen nahtlosen Datenfluss sicherzustellen. Enthalten sind ein Geschäftsprozess-Modeler, ein integriertes Änderungsmanagement und ein interaktives Dashboard, um Innovation zu fördern und die Effizienz Ihrer Organisation zu steigern.

Maximierung von PLM mit Low Code und der Expertise von CLEVR
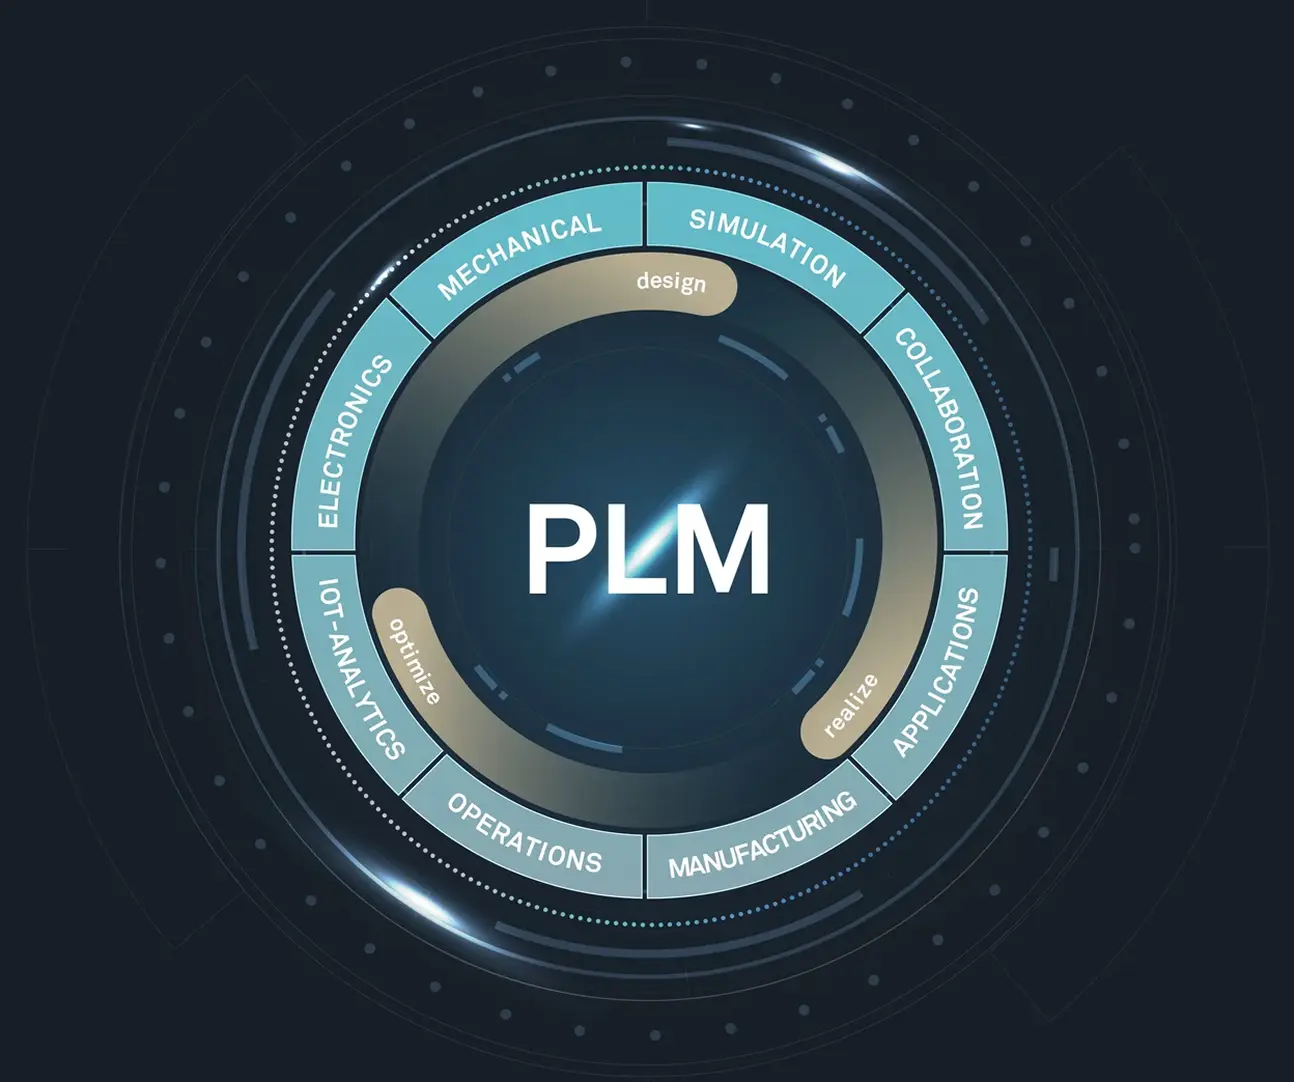
Richtiges Product Lifecycle Management macht aus Ideen erfolgreiche Produkte (mit den erforderlichen Unterstützungsangeboten und Feedback-Schleifen). Es handelt sich um einen systematischen Ansatz zur Verwaltung des gesamten Lebenszyklus eines Produkts, von der Entwicklung und Herstellung bis hin zur Wartung und Entsorgung. Wichtig ist, dass es die Zusammenarbeit zwischen Menschen, Prozessen und Produkten stärkt und sich auf die großen und kleinen Prozesse konzentriert, die den Unterschied ausmachen.
PLM steht an der Spitze von Industrie 4.0 und integriert fortschrittliche Technologien wie KI, IoT und MES. Diese Integrationen ebnen den Weg für ein intelligentes Fertigungsökosystem.
CLEVR bietet innovative Lösungen, mit denen Hersteller ihre digitalen Prozesse mühelos mit realen Abläufen verbinden können.
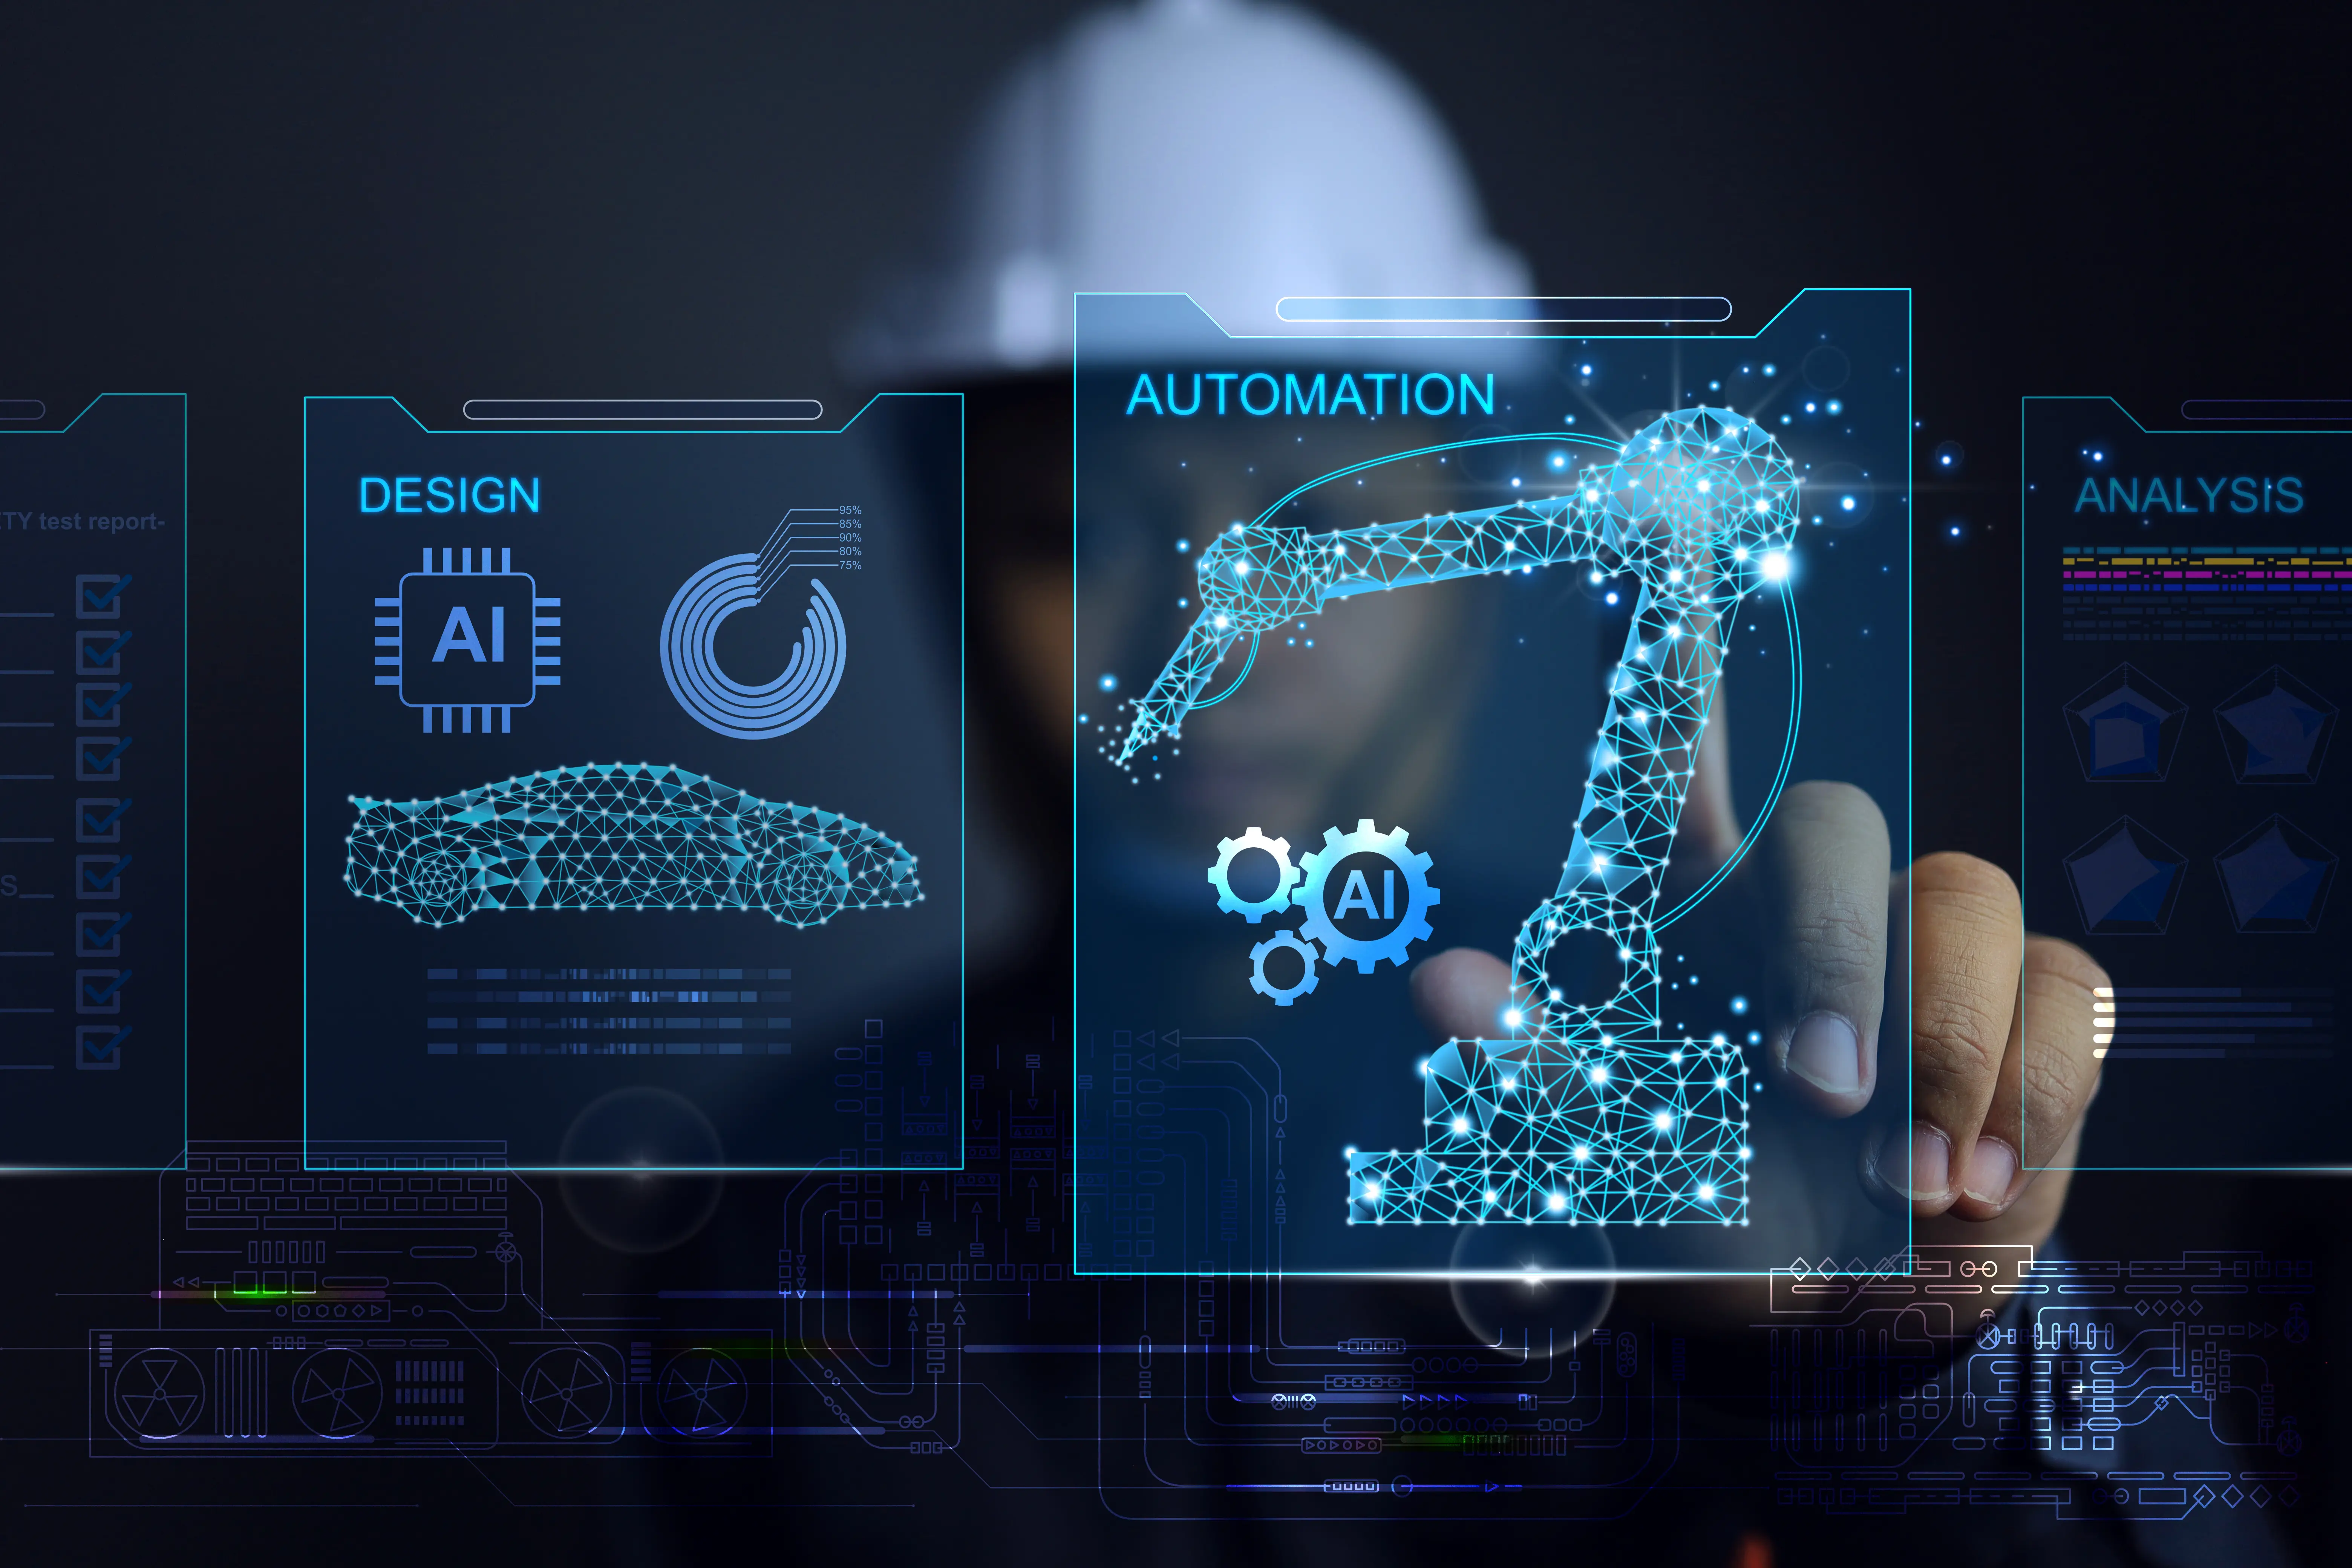
Förderung des Fertigungsökosystems mit KI und MES
Fertigungsleitsysteme
MES optimieren das PLM, indem sie Fertigungsabläufe konsequent an die Geschäftsstrategie anpassen. Sie überwachen Echtzeitdaten zu Produktionsaufträgen, Materialverbrauch, Qualitätskennzahlen und Lagerbeständen, was zu einer verbesserten Effizienz und Entscheidungsfindung führt.
KI im Produktlebenszyklusmanagement
PLM nutzt maschinelles Lernen für mehr Effizienz und optimierte Prozesse, was durch die strategische Partnerschaft zwischen CLEVR und DFKI bereichert wird. Durch den Einsatz von Datenwissenschaft, ML und KI wird PLM verbessert, sodass Unternehmen die Produktentwicklung verfeinern, Kosten senken und die Gesamteffizienz steigern können.
Geschichten von unseren Kunden
Erfahren Sie, wie sich Unternehmen wie Ihres mit CLEVR verändern.
CLEVRs Branchenkenntnisse und Erfahrung in der Automatisierung komplexer Großhandelsprozesse haben uns geholfen, eine zukunftssichere Produktlebenszyklusmanagement (PLM)-Umgebung zu schaffen. Wir sind mit der Zusammenarbeit sehr zufrieden. Es hat von Anfang an gepasst. Wir halten uns gegenseitig auf Trab und machen uns komplementäres Fachwissen zunutze.


CLEVR schlug einige neue Möglichkeiten vor, wie wir Teamcenter nutzen könnten, die wir noch nie gesehen hatten.


Mendix ermöglicht es uns, uns schnell an neue gesetzliche Anforderungen und Sicherheitsupdates anzupassen.

Ich denke, wir bauen die Zukunft auf unterschiedliche Weise zusammen. Wir versuchen, die Zukunft zu gestalten, indem wir Anlagen zur Herstellung von grünem Wasserstoff bereitstellen, um den grünen Übergang zu ermöglichen, und CLEVR mit der Informationstechnologie wird uns dabei helfen, dies effizient zu tun


Verwandte Blog-Artikel
KI in der Fertigung: Transformation von Produktkostenmanagement-Software und Nachhaltigkeitsentscheidungen
Schnellere Designzyklen, automatisierte Engineering-Workflows und reduzierter manueller Aufwand über alle Prozesse hinweg. Diese Fortschritte bauen auf einem langjährigen Versprechen der Digitalisierung in der Fertigung auf: Daten, Systeme und Prozesse zu verbinden, um Effizienz und Entscheidungsfindung zu verbessern. Während wir nun in das Zeitalter der KI in der Fertigung eintreten, wird dieses Versprechen exponentiell verstärkt.
In einem vernetzten Fertigungsökosystem, in dem Daten über PLM-, ERP-, MES- und Lieferantennetzwerke fließen, hat KI das Potenzial, diese Daten zu nutzen, um nicht nur Aufgaben, sondern auch Entscheidungen zu automatisieren. Kostenoptimierung, Reduzierung des CO2-Fußabdrucks in der Fertigung und Kontextualisierung von Betriebsdaten sind nur einige der Möglichkeiten, wie KI ein neues Maß an Erkenntnissen im gesamten Siemens Teamcenter-Ökosystem erschließen kann, in einer Branche, die lange mit fragmentierten Daten und begrenzter Transparenz.
Dies wirft eine wichtige Frage für Hersteller auf. Wo positioniert sich Enablement-Software in diesem Spektrum, und wie bereit sind Unternehmen, sich auf diese Zukunft zuzubegen?
KI-Copiloten in der Produktkostenmanagement-Software
Siemens unternimmt bereits aktive Schritte in Richtung dieser agentischen Zukunft, indem es Copiloten in seinem gesamten Ökosystem einführt, wobei das Produktkostenmanagement einer der ersten Bereiche ist, in denen diese Intelligenz die Entscheidungsfindung direkt beeinflusst.
Obwohl sich diese noch in einer Pilotphase befinden, Copiloten zeigen bereits, wie KI Kosten-Engineering-Aufgaben optimieren kann, indem sie Funktionen wie den automatisierten Teileabgleich, die sofortige Generierung von Stücklisten (BOM) und Arbeitsplänen (BOP) sowie beschleunigte „Was-wäre-wenn“-Szenario-Simulationen ermöglichen.
Anstatt Zeit mit dem Aufbau und der Pflege von Modellen zu verbringen, können sich Teams von nun an auf die Bewertung von Szenarien, den Vergleich von Alternativen und die Entscheidungsfindung konzentrieren. Komplexe Analysen, die zuvor einen erheblichen manuellen Aufwand erforderten, können nun schneller und mit größerer Konsistenz durchgeführt werden.
Für Unternehmen bedeutet dies:
- Schnellere Bewertung von Design- und Beschaffungsoptionen
- Geringere Abhängigkeit von manueller Datenaufbereitung
- Konsistentere und zuverlässigere Kostenmodelle
- Die Möglichkeit, mehr Szenarien in kürzerer Zeit zu erkunden
KI-fähige Fertigungsdaten für Produktkostenmanagement und Nachhaltigkeit aufbauen
Für Fertigungsunternehmen ist das Fundament entscheidend. Um KI sicher zu operationalisieren, müssen Unternehmen zunächst ihre Daten operationalisieren. Unstrukturierte Daten führen zu fragmentierten Arbeitsabläufen, und fragmentierte Arbeitsabläufe sind einer der Hauptgründe, warum KI-Initiativen über Pilotphasen nicht hinauskommen. Hier geht Siemens einen weiteren wichtigen Schritt. Durch die Weiterentwicklung der Speicherung und Strukturierung von Unternehmensdaten, wird die zugrunde liegende Basis gestärkt, die erforderlich ist, um diese Funktionen im großen Maßstab effektiv zu gestalten.
1. Cloud für skalierbares KI-gestütztes Produktkostenmanagement
Da sich KI hin zu autonomeren und agentengesteuerten Arbeitsabläufen entwickelt,benötigen Unternehmen Plattformen, die skalierbar, vernetzt und kontinuierlich aktualisiert werden. Cloud-Umgebungen bieten diese Grundlage, und deshalb ist die Fähigkeit, Unternehmensumgebungen in die Cloud zu überführen, ein Schlüsselelement.
Mit den neuesten Verbesserungen im Teamcenter Product Cost Management können bestehende Benutzer ihre Wert-Plugins und angepassten Kostenaufschlüsselungen in die Cloud-Umgebung übertragen, ohne die Funktionalität zu verlieren, auf die sie angewiesen sind. Dies ermöglicht Unternehmen, eine höhere Skalierbarkeit zu erreichen, Innovationszyklen zu beschleunigen und den Betriebsaufwand zu reduzieren, während gleichzeitig eine zuverlässige Grundlage für fortschrittliche Analysen und KI-gestützte Entscheidungsunterstützung im großen Maßstab geschaffen wird.
2. Benutzererfahrung für schnellere Kosten- und Nachhaltigkeitsentscheidungen
Eine modernisierte Benutzeroberfläche reduziert Reibungsverluste in den täglichen Arbeitsabläufen und verbessert den Zugang zu relevanten Daten. Anstatt komplexe Systeme zu navigieren, können Benutzer die benötigten Informationen nun leichter finden, interpretieren und darauf reagieren. Verbesserte Navigation, neu organisierte Layouts und ein intuitiverer Zugang zu Kernfunktionen sind einige Beispiele für solche Verbesserungen, während verbesserte Suchfunktionen und eine klarere Datenvisualisierung es Teams ermöglichen, sich effizienter auf die Bewertung von Kostentreibern, den Vergleich von Szenarien und die Entscheidungsfindung zu konzentrieren.
3. APIs und Datenbereitschaft für Fertigungsintelligenz
Schließlich hat Siemens wichtige Schritte unternommen, um die Art und Weise, wie Systeme Daten interpretieren und Erkenntnisse generieren, weiter zu optimieren. Dadurch wird sichergestellt, dass Unternehmenswissen nicht nur verfügbar, sondern auch strukturiert, vernetzt und zugänglich ist, um fortschrittliche Analysen und skalierbare KI-gestützte Anwendungen zu ermöglichen.
Erweiterte Berechnungsfunktionen und REST-API- Erweiterungen ermöglichen Automatisierung, Integration mit externen Systemen sowie fortschrittlichere Berichte und Analysen.
Verbesserungen bei Datenmodellen, KPI-Flexibilität und der Transparenz der Fertigungskosten bieten eine detailliertere und genauere Sicht auf Kostentreiber und Rentabilität.
Wie CLEVR Produktkostenmanagement-Software und KI in der Fertigung ermöglicht
Technologie allein schafft keine Intelligenz. Unternehmen müssen weiterhin definieren, wo Entscheidungen getroffen werden, welche Daten diese untermauern sollen und wie Erkenntnisse in den täglichen Betrieb integriert werden können. Dies beginnt mit der Strukturierung von Daten auf konsistente und skalierbare Weise, und der Sicherstellung, dass Produkt-, Kosten- und Betriebsdaten systemübergreifend standardisiert werden.
Von dort aus können Arbeitsabläufe automatisiert werden, um Geschäftsregeln, technische Logik und Finanzmodelle direkt in Prozesse zu integrieren – eine Grundlage, auf der KI-Modelle effektiv aufbauen können, indem sie aus zuverlässigen Daten lernen und Erkenntnisse liefern, die präzise, umsetzbar und auf die Arbeitsweise des Unternehmens abgestimmt sind.
Bei CLEVR, kombinieren wir tiefgreifende Branchenexpertise mit einem Team von Spezialisten für fortschrittliche Softwarelösungen, um Herstellern zu helfen, diese Fähigkeiten in messbare Ergebnisse umzusetzen. Mit über 30 Jahren Erfahrung in der Bereitstellung maßgeschneiderter Technologielösungen in den Bereichen Fertigung, Schifffahrt, Luft- und Raumfahrt sowie Verteidigung verstehen wir die Realitäten komplexer, historisch gewachsener Umgebungen und wie man sie weiterentwickelt.
Durch die Anpassung führender Plattformen wie Siemens und Mendix an den jeweiligen Kontext jedes Unternehmens arbeiten wir eng mit unseren Kunden zusammen, um Domänenwissen, Geschäftsregeln und technische Logik in skalierbare Workflows zu integrieren und diese dort mit KI zu erweitern, wo sie den größten Mehrwert bietet. In der Praxis bedeutet dies, dass wir ein strukturiertes Kosten- und Nachhaltigkeitsmanagement aktivieren, unterstützt durch die Governance und Orchestrierung, die in einer zunehmend komplexen und datengesteuerten Zukunft erforderlich sind.
Während sich das Produktkostenmanagement weiterentwickelt und KI sich in der gesamten digitalen Landschaft etabliert, haben Hersteller die Möglichkeit, neu zu überdenken, wie Erkenntnisse zu Kosten, Nachhaltigkeit und Rentabilität genutzt werden, und sie mit dem richtigen Partner in leistungsstarke Entscheidungsmaschinen zu verwandeln.

CLEVR x ET Advisory: Weiterentwicklung der digitalen Technik im Siemens-Ökosystem
Hersteller komplexer Produkte stehen zunehmend unter dem Druck, Nachhaltigkeit und Rentabilität in Einklang zu bringen. Inmitten globaler, kohlenstoffintensiver Lieferketten, die immer noch stark von fossilen Energien und ressourcenintensiven Produktionsprozessen abhängig sind, müssen sie die CO2-Emissionen reduzieren und die sich schnell entwickelnden Nachhaltigkeitsvorschriften einhalten. Und das alles unter Wahrung der Margen.
Bei komplexen Produkten mit Tausenden von Komponenten haben Konstruktionsentscheidungen erhebliche Auswirkungen auf die Kosten und den CO2-Fußabdruck. Doch genau hier fehlt es den meisten Fertigungsunternehmen an den notwendigen Erkenntnissen, um selbstbewusst handeln zu können.
Die meisten wichtigen Entscheidungen werden zu früh und zu blind getroffen
Trotz erheblicher Investitionen in PLM, CAD und MOMSystems Kosten- und Nachhaltigkeitsinformationen sind nach wie vor unzusammenhängend aus alltäglichen technischen Entscheidungen. In der Praxis wird die Kostenrechnung immer noch über fragmentierte Excel-Modelle mit begrenzter Rückverfolgbarkeit verwaltet, während Nachhaltigkeit oft als nachgelagerte Berichterstattung behandelt wird und nicht als Input, der aktiv die Konstruktionsentscheidungen beeinflusst.
Das hat zur Folge, dass Teams zu kostspieligen Neugestaltungszyklen gezwungen sind, die Entscheidungsfindung durch manuelle Übergaben zwischen Technik, Finanzen und Betrieb verlangsamt wird, und kritisches Wissen bleibt fragmentiert. Bei CLEVR sehen wir das ständig. Sowohl die Störung des täglichen Betriebs, die all dies für die Hersteller mit sich bringt, als auch die deutliche Veränderung auf dem Markt.
Kunden suchen zunehmend nach Transparenz in Bezug auf Kostenstrukturen und Umweltauswirkungen und entfernen sich allmählich davon, PLM-, MOM- und CAD-Systeme als eigenständige Endziele zu betrachten. Es besteht eine wachsende Erwartung, dass digitale Plattformen sollten echte Geschäftsentscheidungen aktiv unterstützen, und genau dafür sind wir jetzt besser aufgestellt.
Von Aufzeichnungssystemen zu Entscheidungssystemen
In der Praxis arbeiten die meisten Organisationen immer noch im Berichtsmodus. Kostenberechnungen basieren in der Regel auf Schätzungen der Material-, Arbeits-, Werkzeug- und Lieferantenpreise, während Nachhaltigkeitskennzahlen häufig auf Benchmark- oder Referenzdaten beruhen. Zum Zeitpunkt der Erstellung dieser Zahlen stehen wichtige Konstruktionsentscheidungen bereits fest, sodass die Hersteller gezwungen sind, entweder niedrigere Margen in Kauf zu nehmen oder zur Konstruktionsphase zurückzukehren und das Produkt zu überarbeiten.
Mit der Hinzufügung von ET Advisory können diese Erkenntnisse nun eingebettet werden direkt in den Produktlebenszyklus, und definieren neu, wie Entscheidungen getroffen werden. Indem Sie eine Verbindung herstellen Kosten- und CO2-Daten Wir orientieren uns direkt an der sich ändernden Stückliste und stimmen technische Entscheidungen mit den Produktionsrealitäten und den Angaben unserer Lieferanten ab.
Gleichzeitig erweitern wir dies um ein tieferes Verständnis dafür, wie Produkteigenschaften, Leistung und Marktdynamik das Preis- und Margenpotenzial beeinflussen. Auf diese Weise können Unternehmen nicht nur verstehen, was ein Produkt kosten sollte, sondern auch, wie es auf dem Markt positioniert werden sollte.
Insbesondere können Fertigungsteams:
- Definieren und kontrollieren Sie Kostenziele von den frühesten Entwurfsphasen an über Design-to-Cost- und Target-Costing-Ansätze
- Erstellen Sie genaue Bottom-up-Kostenmodelle auf der Grundlage von Produktstrukturen, Materialien und Herstellungsverfahren
- Beurteilen Sie die Rentabilität über den gesamten Produktlebenszyklus hinweg mithilfe einer szenariobasierten Analyse von Margen und Investitionen
- Stärken Sie die Beschaffung durch faktengestützte Lieferantenverhandlungen durch Einkaufspreisanalysen und Sollkostenkalkulationen
- Schaffen Sie transparente und wettbewerbsfähige Preisstrukturen, die sowohl die Kostentreiber als auch die Marktdynamik widerspiegeln
- Optimieren Sie Ihre Investitionen in Werkzeuge und Fertigung mit detaillierten Einblicken in die Werkzeugkosten
Anstatt mit statischen Schätzungen zu arbeiten, können Teams Modellieren Sie Produktkosten und Emissionen auf Komponenten- und Baugruppenebene, simulieren verschiedene Konstruktions-, Material- und Herstellungsszenarien und verstehen, wie sich diese Entscheidungen sowohl auf die Kosten als auch auf die Marktpositionierung auswirken.
Ein einheitlicher digitaler Thread für Technik, Kosten und Nachhaltigkeit
Mit der Hinzufügung von ET Advisory entwickelt sich CLEVR weiter von einem Implementierungspartner zu einem echten Entscheidungsträger.
Durch das Aktivieren Einblicke in Technik, Beschaffung und Finanzen Während des gesamten Produktlebenszyklus können wir Unternehmen dabei unterstützen, mit denselben Daten zu arbeiten, Kompromisse frühzeitig zu bewerten und fundierte Entscheidungen zu treffen, um einen dynamischen und umsetzbaren Überblick über Produktkosten, Fußabdruck und Wert zu erhalten. Dies ist besonders wichtig für Branchen wie Automobil-, Industriemaschinen, Schwermaschinen und Verteidigung, wo die Produktkomplexität vollständige Prozesstransparenz und Vertrauen erfordert, um zeitnahe, datengestützte Entscheidungen zu treffen.
Aufbauend auf unserer Expertise in den Bereichen PLM, Low Code, Data Science und KI binden wir spezielle Fachkenntnisse in den Bereichen Kosten und Nachhaltigkeit direkt in unser Bereitstellungsmodell ein und stellen so sicher, dass diese Erkenntnisse nicht nur verfügbar sind, sondern auch aktiv in Engineering- und Geschäftsprozessen genutzt werden.
Für Kunden bedeutet dies eine grundlegend andere Arbeitsweise. Sie können wertorientierte Anwendungsfälle wie Designoptimierung, Lieferantenverhandlungen, Planung neuer Programme, globale Beschaffungsentscheidungen und Tool-Benchmarking sowie preisorientierte Anwendungsfälle wie erste Preisfindung, Lieferantenkonsolidierung und Portfoliobereinigung nutzen, um nur einige zu nennen.
CLEVR: Wir gestalten die vernetzte Zukunft des digitalen Engineerings
Mit der Hinzufügung von ET Advisory CLEVR ist besser positioniert, um Kunden in den Benelux-Ländern, der DACH-Region und den nordischen Regionen nicht nur dabei zu helfen, ihr digitales Rückgrat aufzubauen, sondern es auch aktiv zu nutzen, um Kosten, Nachhaltigkeit und Produktergebnisse zu steigern.
Auf diese Weise entwickeln sich bestehende Siemens-Investitionen von Aufzeichnungssystemen zu Entscheidungsmaschinen. Und CLEVR treibt diesen Wandel voran und ermöglicht es Unternehmen, von reaktiven Entscheidungen zur Entwicklung kosteneffizienter, konformer und nachhaltiger Produkte überzugehen.
Wie Sie KI verantwortungsbewusst, strategisch und auf eine Weise einbetten, die Ihre Belegschaft unterstützt
KI ist ein Tsunami, er kommt. Die Frage ist nicht, ob du auf der Welle reitest, sondern wie gut du auf ihr reitest.
KI ist eine der transformativsten Technologien unserer Zeit. Sie revolutioniert Branchen, ermöglicht neue Effizienzsteigerungen und treibt Innovationen voran.
Aber mit großer Macht geht große Verantwortung einher. Die Begeisterung für KI geht oft mit Bedenken hinsichtlich ihrer Fairness, Transparenz und langfristigen Auswirkungen auf Arbeitsplätze und Gesellschaft einher.
Die Herausforderung für Unternehmen besteht nicht nur darin, die Fähigkeiten der KI zu nutzen, sondern auch darin, dies verantwortungsbewusst zu tun. Durch die Integration von KI-Governance, Erklärbarkeit und Compliance stellen Unternehmen sicher, dass sie effektiv mitfahren, ohne die Kontrolle zu verlieren.
KI macht deinen Job besser: Empowerment statt Ersatz
Eines der größten Missverständnisse über KI ist, dass sie darauf ausgelegt ist, Menschen zu ersetzen. In Wirklichkeit geht es bei KI um Empowerment, es geht darum, Menschen dabei zu helfen, intelligentere Entscheidungen zu treffen, und zwar schneller und mit mehr Einblicken.
Nehmen wir zum Beispiel OOE-Dashboards. Sie geben dir die Daten, aber was machst du damit? KI liefert nicht nur Informationen, sie wandelt Daten in umsetzbare Erkenntnisse um und hilft den Menschen, diese Informationen zu interpretieren und darauf zu reagieren.
Der wahre Wert von KI liegt in ihrer Fähigkeit, das menschliche Urteilsvermögen zu verstärken, anstatt es zu ersetzen. KI unterstützt den menschlichen Entscheidungsprozess, indem sie Daten filtert, Optionen vorschlägt und Ergebnisse vorhersagt, aber letztlich bleibt der Mensch am Steuer.
Aufbau einer verantwortungsvollen KI-gesteuerten Organisation
1. Die drei Kernkompetenzen von Michael Wade für verantwortungsvolle KI
Um die Integration von KI in Unternehmen erfolgreich zu bewältigen, müssen sich Führungskräfte die drei Kernkompetenzen von Michael Wade zunutze machen:
Hyperbewusstsein
KI ermöglicht es Unternehmen, auf einer Goldmine von Daten zu sitzen. Um diese Macht nutzen zu können, müssen Unternehmen wissen, wie und wo Daten durch ihre Systeme fließen. Dieses Bewusstsein führt zu fundierteren, proaktiven Entscheidungen.
Informationsgestütztes Entscheidungsdenken
KI ermöglicht es Führungskräften, über Intuition hinauszugehen. Mit datengestützten Erkenntnissen können Führungskräfte Entscheidungen treffen, die auf der Realität basieren, nicht nur auf Erfahrungen. Dieses Denken ist der Schlüssel zur Erschließung des wahren Potenzials der KI.
Schnelle Ausführung
KI hilft Unternehmen, schneller auf sich ändernde Marktbedingungen zu reagieren und die Agilität zu verbessern. Es geht darum, Entscheidungen schnell zu skalieren, Prozesse anzupassen und Innovationen schnell zu entwickeln, während der Kern intakt bleibt. Bei der schnellen Ausführung trifft menschliche Kontrolle auf die analytische Leistungsfähigkeit der KI.
Diese Fähigkeiten bilden die Grundlage für eine verantwortungsvolle Einführung von KI, aber ohne Vertrauen bedeuten Bewusstsein und Geschwindigkeit wenig.
2. Stellen Sie Erklärbarkeit her, um Vertrauen in KI aufzubauen
KI funktioniert am besten, wenn die Leute ihr vertrauen. Aber Vertrauen kommt nicht automatisch. Wenn KI-Entscheidungen nicht erklärbar sind, können Unternehmen leicht an Glaubwürdigkeit verlieren.
Erklärbarkeit stellt sicher, dass alle Beteiligten, vom Mitarbeiter bis zum Kunden, verstehen, wie Entscheidungen getroffen werden.
In Sektoren wie dem Bankwesen, dem Gesundheitswesen oder dem verarbeitenden Gewerbe, in denen sich Entscheidungen direkt auf das Leben der Menschen auswirken, ist dieses Vertrauen von entscheidender Bedeutung. Wenn diese Erklärbarkeit berücksichtigt wird, werden KI-Modelle transparenter und verständlicher. Diese Klarheit schafft Vertrauen und macht KI zu einem Wegbereiter für verantwortungsvolle Innovationen und nicht zu einem Blackbox-Risiko.
3. Schaffen Sie eine starke Unternehmensführung, um den Einsatz von KI zu steuern
Da KI-Systeme zunehmend in Geschäftsprozesse integriert werden, spielt die Unternehmensführung eine zentrale Rolle. KI ist nicht nur eine Technologie, die isoliert eingesetzt werden kann, sondern eine strategische Fähigkeit, die auf allen Ebenen des Unternehmens verwaltet und überwacht werden muss.
Ohne eine starke Unternehmensführung kann KI schnell zu einem Risiko und nicht zu einem Vorteil werden. Dieser Governance-Rahmen stellt sicher, dass KI innerhalb ethischer Grenzen eingesetzt wird und dass sie mit den Werten und strategischen Zielen des Unternehmens in Einklang gebracht wird.
Führungskräfte müssen klare Richtlinien dafür festlegen, wie KI implementiert wird, wer für Entscheidungen verantwortlich ist und wie sie reguliert wird. Durch die Einrichtung einer angemessenen Unternehmensführung können Unternehmen Risiken wie Vorurteile, unethisches Verhalten und unbeabsichtigte Schäden mindern.
4. Machen Sie KI zu einer strategischen Fähigkeit, nicht zu einem technischen Projekt
KI ist zu wichtig, um sie nur als technisches Experiment zu behandeln. Damit KI einen echten Unternehmenswert liefern kann, muss sie in die strategischen Unternehmensziele integriert werden.
Allzu oft wird KI als eigenständiges Projekt oder technologischer Trend behandelt. Die Implementierung von KI ohne eine klare Vorstellung davon, wie sie mit den Geschäftsabläufen in Einklang gebracht wird, kann zu fragmentierten Implementierungen führen.
Bei KI geht es nicht nur um Technologie, sondern auch um Strategie.
Der Schlüssel zur skalierbaren Einführung von KI liegt darin, KI als strategischen Wegbereiter für die Geschäftstransformation zu betrachten. Führungskräfte müssen sicherstellen, dass KI mit der langfristigen Vision des Unternehmens übereinstimmt und zu Verbesserungen der Effizienz, Kundenzufriedenheit und Nachhaltigkeit führt.
5. Führen Sie das Unternehmen zur Einführung und zum Vertrauen in KI
Der Erfolg jeder KI-Initiative hängt von der Führung ab. Ohne starke Führung kann KI schnell zu einem Instrument werden, das unbeabsichtigte Folgen wie Vorurteile oder Kontrollverlust verursacht.
Es muss sichergestellt werden, dass KI verantwortungsbewusst als Instrument zur Verbesserung der Entscheidungsfindung eingesetzt wird, nicht nur zur Verbesserung der Effizienz oder des Gewinns.
Führungskräfte müssen auch die Anleitung und den Rahmen bieten, damit die Mitarbeiter der KI vertrauen können. Das bedeutet, eine Kultur zu fördern, in der KI das menschliche Urteilsvermögen verstärkt, anstatt es zu ersetzen. Wenn KI als Instrument zur Selbstbestimmung betrachtet wird, das Menschen hilft, bessere, schnellere und genauere Entscheidungen zu treffen, wird sie zu einer treibenden Kraft für positive Veränderungen.
KI ersetzt Urteilsvermögen nicht, sie verstärkt es
KI ersetzt menschliche Entscheidungen nicht, sie unterstützt und verstärkt sie. KI ist in den Geschäftsbetrieb integriert und übernimmt keine Entscheidungen, sondern liefert den Kontext und die Erkenntnisse, um sie zu verbessern.
Die Zukunft der KI liegt in der Zusammenarbeit zwischen menschlicher Intuition und maschinellem Lernen. Solange der Faktor Mensch das Sagen hat, können Unternehmen darauf vertrauen, dass KI die Kontrolle verbessert und nicht untergräbt.
Letztlich geht es bei verantwortungsvoller KI nicht nur um Algorithmen oder Compliance, sondern auch darum, dass Menschen der Technologie genug vertrauen, um sie mit Bedacht einzusetzen. KI ermöglicht es den Menschen, klarer und nicht mit weniger Kontrolle zu handeln. Das ist das wahre Maß für Transformation.
Ursprünglich veröffentlicht hier.