01 First things first
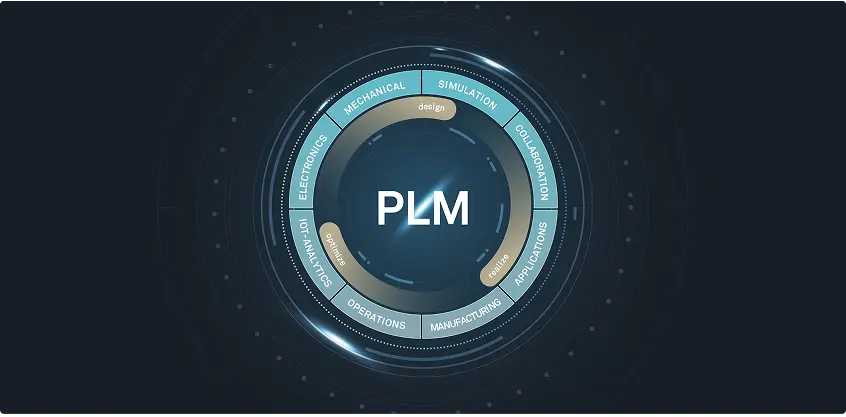
Product Lifecycle Management (PLM)
Product Lifecycle Management (PLM) is a strategic approach to developing, managing, and improving products from conception to disposal—a way of dealing with the different stages across a product lifecycle. However, it can also be a piece of software (or system) that helps manufacturing organizations and Engineering-to-Order (ETO) companies efficiently work through these different stages.
By blending existing procedures and processes with individual expertise and innovative technology, PLM software like Siemens Teamcenter provides a framework that enhances product quality, reduces costs, and accelerates time to market. Product Lifecycle Management software offers a single platform for all product data and related processes. This single source of truth makes it easier for stakeholders to find the most up-to-date information, allowing them to make the right decisions more quickly and efficiently.
02 The stages of PLM
What, when, and why?
From a manufacturing and ETO perspective, Product Lifecycle Management can be divided into five main stages: Conception, Design and Engineering, Manufacturing, Commissioning, and Decommissioning.
{{second-first}}
{{second-second}}
{{second-third}}
{{second-fourth}}
{{second-fifth}}
03 The benefits of PLM
How can PLM help?
The benefits of Product Lifecycle Management for manufacturing aren’t just linked to transparency and timekeeping. Clear protocols facilitated by comprehensive PLM software like Siemens Teamcenter increase the likelihood of creating better-quality products, fewer errors, and greater cost savings thanks to more efficient production processes.
In short, PLM software is crucial for both custom ETO requests and mass-produced products.
{{third-first}}
{{third-second}}
{{third-third}}
{{third-fourth}}
{{third-fifth}}
04 The key components of PLM software
Optimizing the PLM value chain
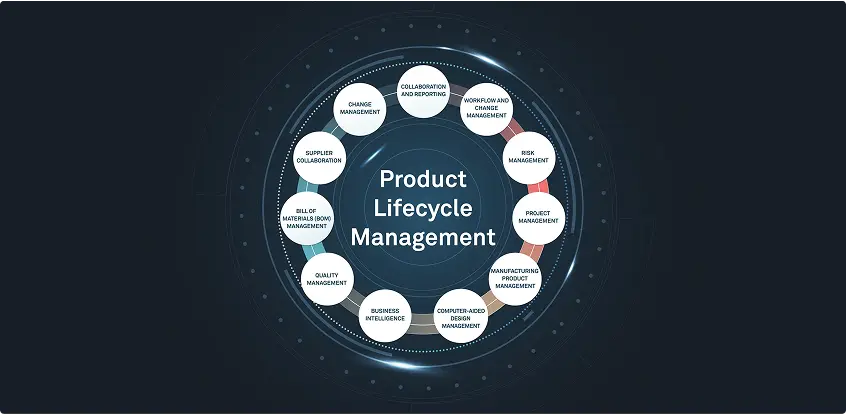
PLM software streamlines the way different manufacturing companies and specific stakeholders can access data. This is done by integrating tools and features to optimize the overall management of a product. Some tools, such as CAD software, are used heavily at specific stages, whereas key components like document management make up the backbone of a PLM system’s overall offering.
Siemens Teamcenter offers a multitude of tools and components that make PLM a no-brainer for manufacturers looking to scale and optimize their business processes without losing track of the original vision for the brand and products.
{{fourth-first}}
{{fourth-second}}
{{fourth-third}}
{{fourth-fourth}}
{{fourth-fifth}}
{{fourth-sixth}}
{{fourth-eighth}}
{{fourth-seventh}}
05 Picking a PLM implementation partner
Ask yourself the right questions
Picking a PLM partner is the first step to increased efficiency, smoother processes, and better data management. However, to ensure your business's needs are met now and in the future, it's worth considering a few things.
{{fifth-first}}
{{fifth-second}}
{{fifth-third}}
{{fifth-fourth}}
{{fifth-fifth}}
{{fifth-sixth}}
06 Digital transformation with CLEVR
Product Lifecycle Management in action
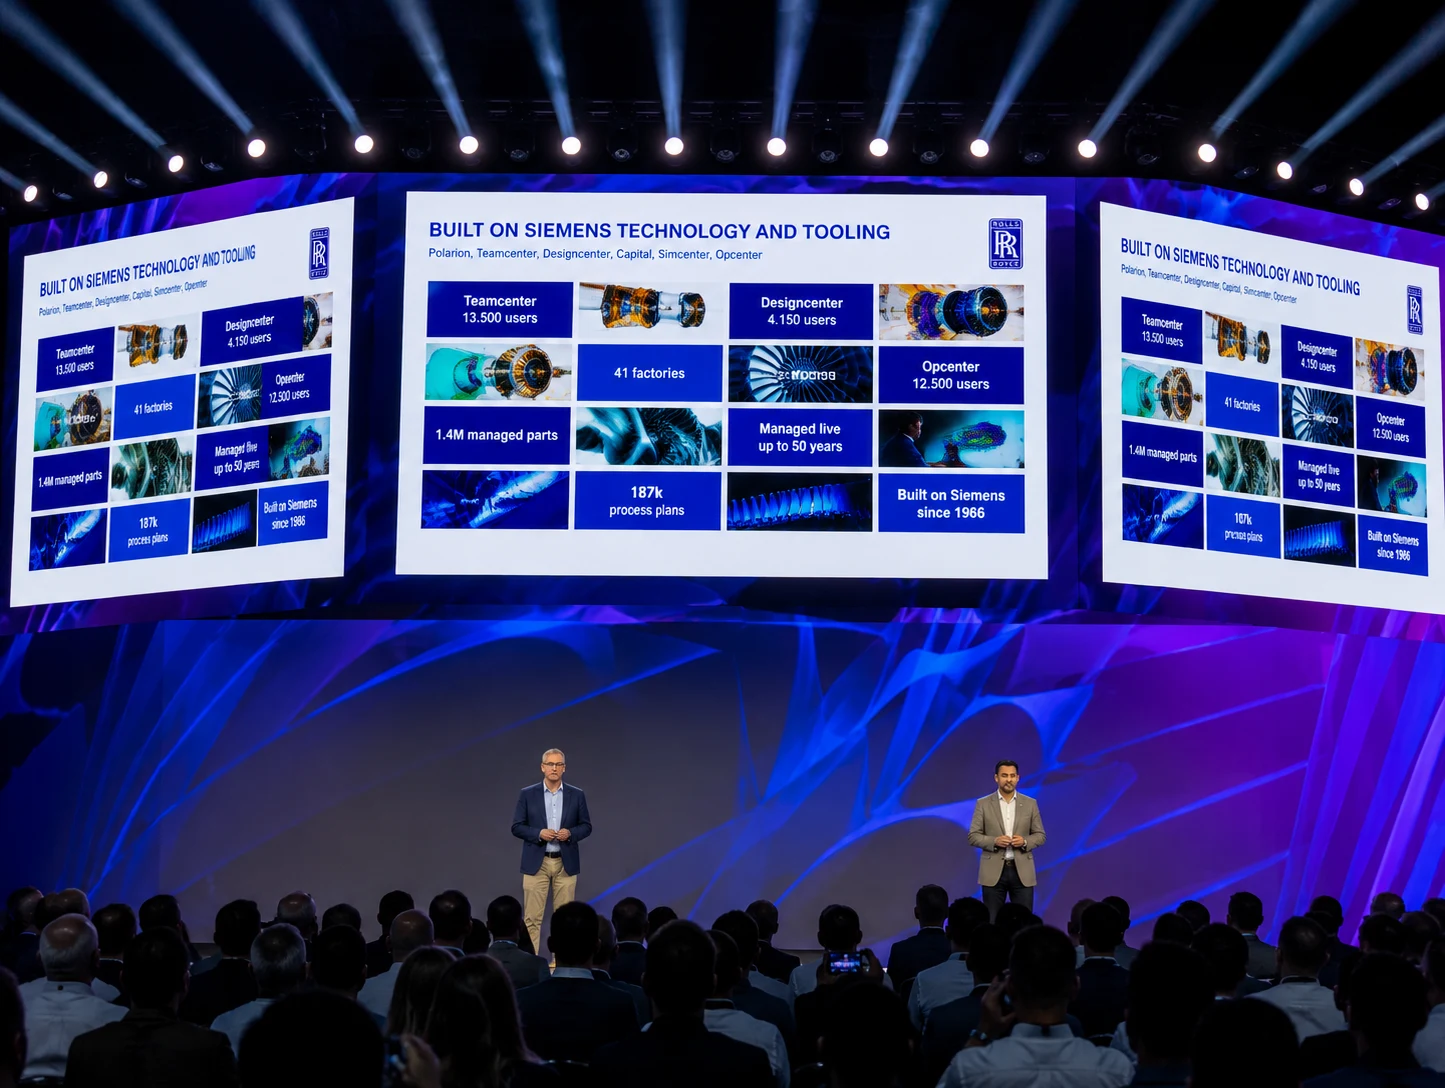
Siemens Teamcenter is a comprehensive PLM software suite offering extensive capabilities for managing product data and processes across the entire product lifecycle.
We chose to partner with Siemens because of Teamcenter’s collection of tools and integrations, as well as its overall usability.
Nel Hydrogen recently partnered with CLEVR to significantly enhance its product development capabilities. By leveraging Siemens Teamcenter, CLEVR is implementing a comprehensive PLM solution that streamlines data management and helps automate engineering processes. The collaboration is ongoing, with a view to expanding the scope of this initial project.
Our expertise in digital transformation and PLM is what sets us apart from other solution partners. We combine extensive industry knowledge with digitalization expertise to implement tailor-made Siemens Teamcenter solutions that automate and streamline product lifecycle processes.
Even as your company scales and adapts to new challenges, your processes remain flexible and robust. Let CLEVR guide you through today’s bold decisions for greater peace of mind.
Design and Engineering
This stage includes hands-on tasks that bring a concept to life; detailed product designs, specifications, and prototypes are the name of the game. Tools like CAD systems help designers visualize ideas, enabling engineers to create prototypes.
Quality Assurance and Engineering departments in larger manufacturing organizations use prototypes to ensure a product meets design and performance requirements before mass production. Feedback from testing highlights the refinements needed for validation.
ETO companies often use virtual prototypes, models, and simulations during this stage. Avoiding too many physical iterations helps keep costs low for businesses that can't benefit as much from economies of scale.
Conception
During the ideation phase, competitive analyses help identify market gaps and customers’ unserved needs. This information is used to conceptualize the product, creating a solid foundation for the subsequent PLM stages and decision-making processes.
Automotive manufacturers may, for instance, conduct a competitive analysis to identify gaps in the market for electric trucks, conceptualizing a new model that meets specific urban delivery service needs.
Manufacturing
From a mass manufacturing perspective, this stage starts with a validated, market-ready product resulting from iterative feedback rounds during development. Once the production process is established, it’s time to scale. Planning, executing, and monitoring the scaled production process involves supply chain management and quality control.
ETO companies usually have a single manufacturing process and only one chance to get an order right. Therefore, this stage depends heavily on accurate information from the Design and Engineering, facilitated by efficient PLM software that gets the right information to the right people at the right time.
Commissioning
For mass manufacturers, this stage consists mainly of introducing the product to the market, distribution, sales, and support. Successful product launches require these aspects to be aligned from the start.
In an ETO context, commissioning involves customizing a product's delivery, installation, and support. Successfully deploying bespoke products requires careful logistics coordination, detailed installation procedures, and tailored customer support.
Managing product effectivity—acquiring spare parts and documentation for a specific product version—is also crucial here.
PLM software helps manage these complex processes by providing precise, up-to-date information to all stakeholders. For example, in an ETO machinery project, PLM ensures that engineering details, installation guides, and support documentation are all aligned, allowing for a smooth transition from production to customer site setup and ongoing support.
Decommissioning
Product decommissioning involves Product Managers, Environmental Compliance personnel, and logistics teams. Retirement isn’t just stopping production—effective communication with customers and suppliers is crucial. A tech company may need to plan for disposing of, recycling, or remanufacturing obsolete laptops, ensuring the remaining stock is sold off or used for spare parts. Letting the right people know exactly how these processes should be expected to work is almost as important as the procedures themselves.
For ETO companies, decommissioning involves carefully planning the phase-out of custom products and ensuring clients are supported throughout the process.
Enhanced product quality
PLM software creates a single source of truth for all product data, giving (authorized) departments and stakeholders access to the latest information. This comprehensive data management reduces errors resulting from miscommunication or outdated information.
PLM software also supports extensive testing and validation processes, which helps manufacturers identify issues early in the development cycle.
Reduced time to market
PLM software streamlines a product’s development stage by automating workflows and improving communication among teams. Reducing the time spent on administration speeds up decision-making and helps avoid human errors often caused by repetitive, manual tasks.
Enhanced data management and collaboration also improve the efficiency of the earlier lifecycle stages, which leads to quicker market introductions.
Better data management and collaboration
A centralized PLM system ensures that all product data is easily accessible to those who need it, such as marketers creating assets or campaign messages and after-sales personnel creating training assets for customer support staff. This improves data accuracy and consistency, enabling more informed decision-making. PLM software allows and encourages departments to share information in real time, which reduces information silos and keeps everyone on the same page with the most up-to-date information.
Cost savings across the product lifecycle
PLM software helps companies avoid inefficient practices that often clog up business processes. This helps reduce costs associated with product development, manufacturing, and maintenance. It also supports better resource management and reduces the need for costly reworks.
An overview of the production process, including governance and control of automated machinery, lets companies spot material waste and identify ways to optimize production schedules. This reduces manufacturing costs linked to energy consumption and raw materials, which minimizes the environmental impact of a company’s operations. Siemens Teamcenter offers a Carbon Footprint Calculator to help companies assess their decisions as they look to strike a balance between environmental impact, cost reduction, and meeting customer demands.
Integration and connectivity
Siemens Teamcenter offers extensive integration capabilities with real-time data access for better collaboration. This ensures that all departments and stakeholders across the product lifecycle are on the same page. This is crucial for ETO manufacturers and larger organizations aiming to streamline operations, maintain product quality, and scale effectively.
Good PLM software should seamlessly integrate with various enterprise systems and authoring tools, ensuring cohesive product data management throughout its lifecycle. This means creating a seamless flow of information by connecting Enterprise Resource Planning (ERP) systems, Computer-Aided Design (CAD) tools, and document management software.
Computer-aided design (CAD)
CAD software is essential for creating precise 2D and 3D models, allowing engineers and designers to visualize and iterate on product designs. In PLM, CAD integrates design data with other lifecycle processes, ensuring that all design changes are tracked and managed efficiently. As you’d imagine, CAD software is heavily involved in the conception stage of a product’s lifecycle. So is Product Data Management.
Product Data Management (PDM)
PDM centralizes all product-related data—which often changes—ensuring accessibility, accuracy, and security. This invariably improves collaboration and decision-making. Within PLM, PDM manages the lifecycle of product data, including version control and access permissions, ensuring that the latest information is available to the right people.
Bill of Materials (BOM)
A bill of materials (BOM) lists all materials, parts, and assembly configurations required to manufacture a product, which makes it a key feature of the development stage. A BOM represents the product structure in a hierarchical format that clearly presents the relationship between certain components and assemblies. Depending on the product and industry, a BOM can range from a simple, single-level structure to a multi-level structure with specific manufacturing, engineering, and customization guidance.
Like PDM systems, BOM systems track changes. This means that any requested changes to a BOM are documented and sent for approval. A BOM can also include tools to analyze the cost of materials and components. Having an exhaustive and holistic view of the costs will help manufacturers with budgeting forecasts, general cost management, and reporting.
Engineering change management
Engineering Change Management is the tracking, controlling, and approving of changes to product designs and processes. During the development stage, Engineering Change Management helps stakeholders assess the impact of proposed changes on existing designs and processes. It also records modifications, which is vital with the rapid development of a product often containing so many iterations—some of which may need to be revisited for another assessment.
Computer-Aided Manufacturing (CAM)
CAM software automates manufacturing by converting CAD models into machine instructions, enhancing production precision and efficiency. In PLM software, CAM ensures that manufacturing data is consistent with design data, reducing errors and streamlining the transitions between the design, development, and production stages.
Supply Chain Management (SCM)
SCM tools are used in the launch and production phase to manage the flow of goods, information, and finances related to a product. In PLM, SCM ensures that supply chain activities are aligned with product development and production schedules, which improves efficiency and reduces costs.
Document management
This process comprises organizing and managing all documents related to a product’s entire lifecycle. This can include items ranging from compliance records to product brochures. Having the necessary documents in easy-to-find places is key when companies are posed with compliance questions from external regulators. This component is often a feature of the end-of-life phase when companies look to “close the loop” of an existing product, ensuring that it has been produced, distributed, and discontinued in a manner that complies with any number of (changing) regulations.
Compliance and regulatory management
Maintaining a database of the regulations and standards applicable to a product is critical for keeping stakeholders informed on the latest regulatory developments. Sudden changes can result in product non-compliance, which invariably leads to fines and can negatively impact publicity and trust.
This key component provides the tools to track compliance throughout a product’s lifecycle, which helps generate reports needed for regulatory submissions. Audits can often be lengthy and nerve-wracking for companies. So, having an automated process in place to ensure products meet safety and quality standards can help avoid surprises when regulators are sifting through documentation.
Do they provide an end-to-end solution?
Ensure the PLM partner you choose will handle the entire product lifecycle. Those that appear only at certain stages and offer support reactively may struggle to produce the most efficient results for your business.
Are they innovative?
It's good to consider how and if your potential PLM partner embraces new technology. Some tried-and-tested methods are all well and good, but partners that embrace the power of low-code with novel PLM systems like Siemens Teamcenter could provide the spark you need to bring your product processes to the next level.
Do they have the right expertise?
Verifying the expertise of those you're considering to partner with is crucial. How experienced are they when it comes to implementing PLM solutions? Do they have the right connections and partnerships with software providers?
Will they be the right fit for your industry?
Look for partners that offer insights into the PLM space and your specific industry.
Like any good PLM system, an implementation partner should be proactive and have an appreciation for moving digital transformation technology forward across all sectors.
Will they provide you with reliable support?
Ensure your PLM partner will offer support at every stage of the implementation process, focusing on the needs of your business with effective solutions that last.
What about the future?
A good PLM implementation partner shouldn't just ensure your solutions and processes work now. Be certain your partner will create a clear, bespoke PLM roadmap that looks years into the future. If they're focused on the here and now without considering the potential twists and turns within your business and industry, you could be in for some nasty surprises.