
‘Premature optimization is the root of all evil’. This is what Donald Knuth, author of the famous book series The Art Of Computer Programming, wrote in 1974. That does not mean however that you should not optimize for performance at all or wait until the performance problems show up in production.
In this blog article I will suggest when and how to do performance optimization in the application life cycle of Mendix applications.
WHEN TO DO PERFORMANCE OPTIMIZATION?
Let us first treat the ‘when’. There is one simple answer. Always keep performance in mind, but try to design and build the simplest solution of your application first. If the simplest version performs well you are done. Otherwise your application might serve as a prototype for analyzing performance or serve as a test to compare it against a more complex optimized application.
Trivial performance optimizations like obvious indexes and optimal query-where-clauses should always be used. For example when you know an attribute is searched against and the amount of records in the database is large you create an index. And you always build smart query statements (xPath, OQL) that do not use ‘NOT’ in where clauses unless you really have to.
If you develop a new function for your application it is advised to use the performance tools when the functionality works for the first time. Do not wait until all the other stuff like UX, security, maintenance and such are done. It is best to look at performance in parallel with those activities and base your design decisions upon the measured performance facts.
Since we all develop in an agile way, you should test agile as well. So you build up your test scripts and you run them very frequently. If you have automated your test scripts you can run them daily as a regression test and give developer very fast feedback when something is broken. Also when you measure the response times in the script you build up a history and you can do trend analysis on functions even when still in development.
During the test and acceptance sprints you let tooling run along to measure usage by test users and response times of the application. During the test you fill your database with (if needed fake) data to match the (expected) production size or you use a production database dump in later iterations.
During production you measure usage statistics. You also add monitoring scripts for selected functionality to measure behavior in a consistent way. When you run into performance issues in production you need tooling to analyze it quickly. You review the issue and hope it does not lead to a complete redesign of your application. In future blog article I will go into more detail how to approach such issues.
HOW TO DO PERFORMANCE OPTIMIZATION?
Next, let us get into the ‘how’. To analyze performance you need to know what is happening in the application internally (under the hood). You need to be able to link business model items from the Mendix modeler to execution steps in the java runtime, so you know which steps consume a certain amount of time.
Off course performance issues are not limited to the Mendix application or database. It is important to look at the application infrastructure as a whole. This includes the browser, the network, the web server, the Mendix business server, the database and the supporting operating systems and java virtual machines.
The following picture gives a comprehensive overview of the ‘how’:
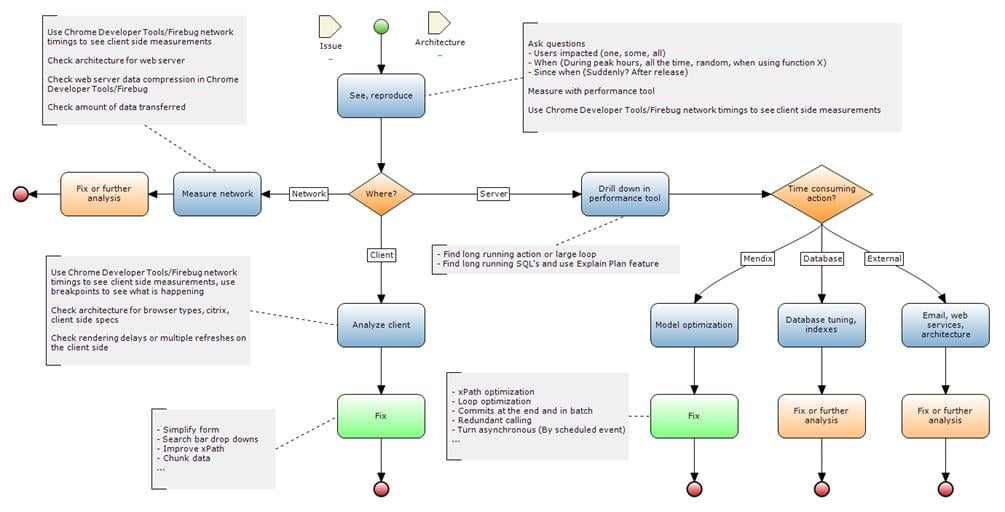
This overview assumes an issue is to be investigated, but you can read ‘new function’ where is says ‘issue’. You first measure the basic responses and see where you need to look further. I will introduce the tools I use in a moment.
After the first step you need to decide where to look further. There is always a part that takes the most time, but if that amount of time is acceptable you can (and often should) decide to stop analyzing and certainly not fall into the trap of pre-mature optimization.
The final steps are the optimizations steps. Once you know where to look for the issue that contributes to a degraded performance of your application, you can zoom into that component. The how to fix performance issues is a whole other topic of a future blog.
Let me now share with you some of the tools I use. The first tool is the developer tool of your browsers (built in or plugged in). These tools allow you to measure and debug just about everything on the client-side. The following screenshot shows the network tab of the Google Chrome Developer tools when logging into a Mendix application:
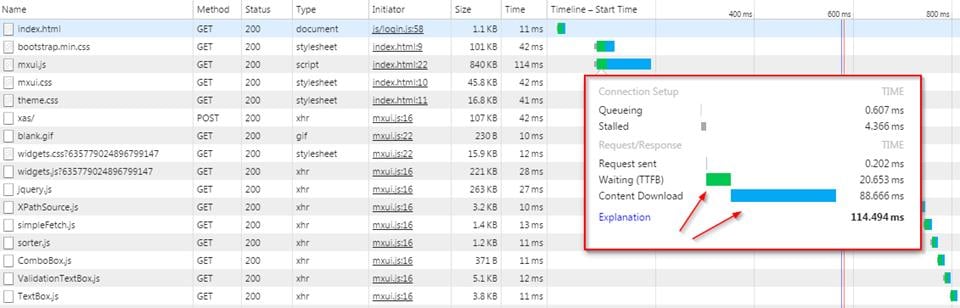
As seen above the network timelines are an easy indication of where to look further. Waiting usually means the server is busy. Content download time can be changed by using compression on a web server or by reducing the amount of content (by selecting less rows or columns in a grid for example).
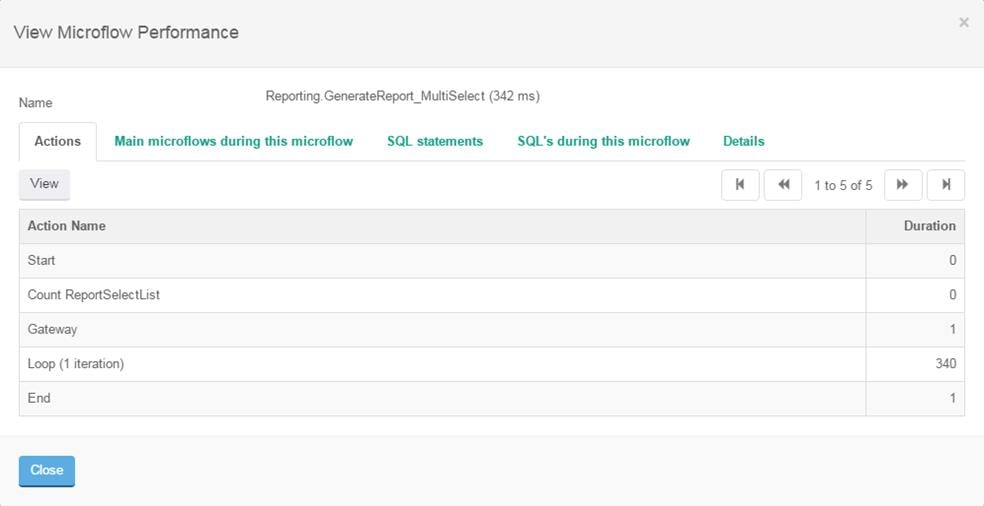
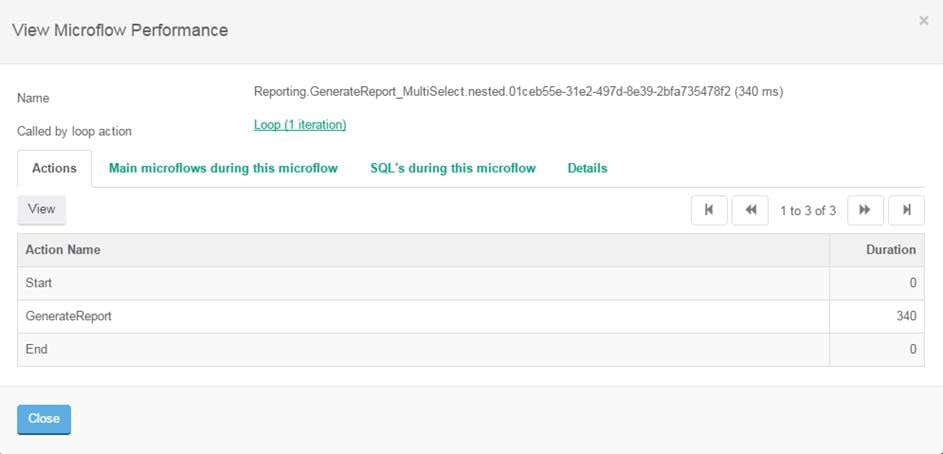
To look further into the time spent on a Mendix Business Server and see what is happening I use CLEVR’ Performance Tool from the APM Tools Suite. With this tool you can drill down into microflows, actions, loops and even see the SQL statements that Mendix generates. In the screenshots below you will see a sequence of steps:
- We first show you the microflow as called when pressing a run report button in our application
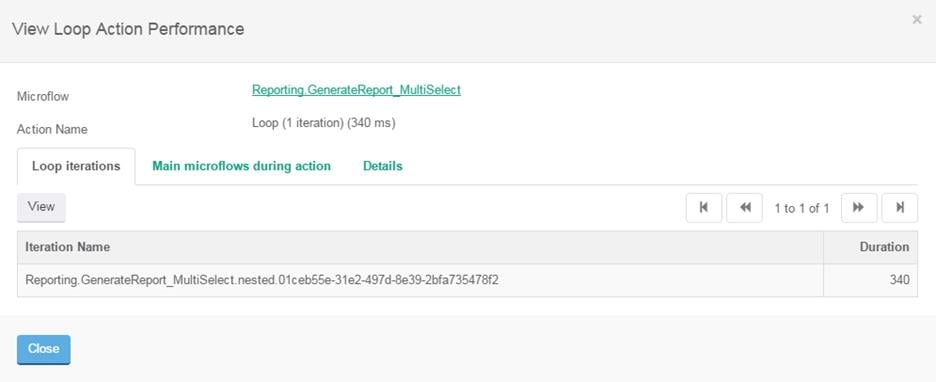
- Next we drill down into:
- The loop action where you can select an iteration
- The ‘loop-microflow’, which is the inside of a loop in the Mendix Modeler
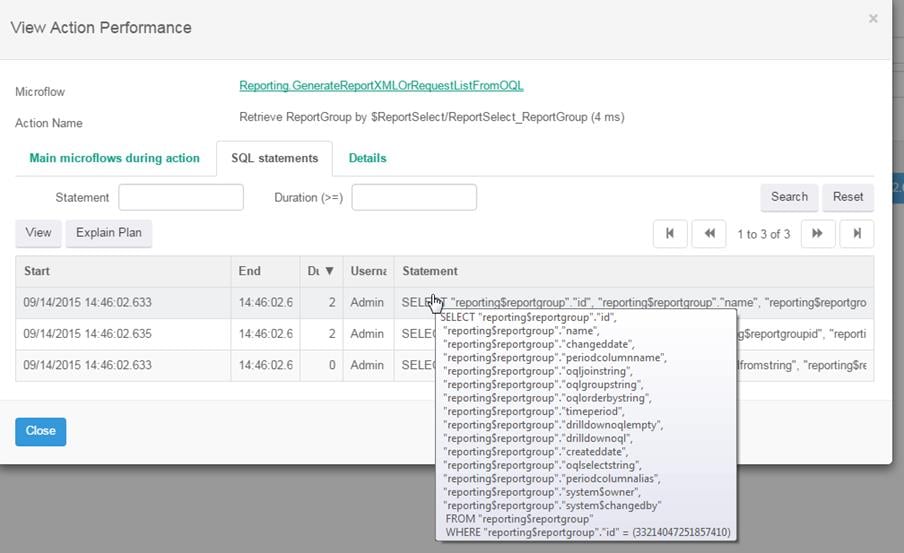
- Finally we drill down some levels deeper until we reach an action that generates a SQL statement
Screenshot of the microflow as called when pressing a run report button:
Then we drill down to the loop-action:
Subsequently we drill down to the loop-microflow, i.e. the inside of the loop in the Modeler:
We drill down further until you reach something you can optimize, for example a database retrieve statement:
The performance tool of the APM suite of tools perfectly helps you to pinpoint where the issue is in your application code.
The performance tool is capable of running in production. If needed with all kinds of safety measures to ensure that you don’t claim too much of the server’s resources. This contributes to the just-in-time part of the title. Sometimes performance issues only appear in production and production is the only place where you can gather information. The performance tool is designed to help you with this.
Yet, another tool I use, is the Statistics tool in the APM Tools Suite. At CLEVR we let this tool run at every customer in production to collect usage information all the time. This tool can be used to get a first impression of which microflows take the most time. Also this tool can point at frequent running microflows that all together consume a lot of time and where a small improvement can thus have a large effect.
The data collected by the statistics tool is also used to make trend analysis reports and see if microflows are slowing down over time because the dataset is growing, or if microflows are slowing down suddenly, maybe due to a new deployment.
The bottom line is that you need good tools to do your job. I’ve created some tools for myself to help me to do my job and CLEVR has bundled them in the APM Tools suite to benefit you. If you want to know read more about the APM Tools suite please go to this page.